The site owner quickly sees whether the problem is hosting, cache, plugins, or the frontend.
Site ownerA clear priority, without guessing where the problem is
Google PageSpeed Insights shows the outcome. Speedlyst adds context that helps you find the cause.
01Memory, PHP, object cache, and WP-Cron, straight from WordPress.
02Anything your host can't measure is labelled as not measured, never faked as a zero.
03Daily history shows both a change and a problem that slowly gets worse.
04All the numbers and reference values in one Markdown file.
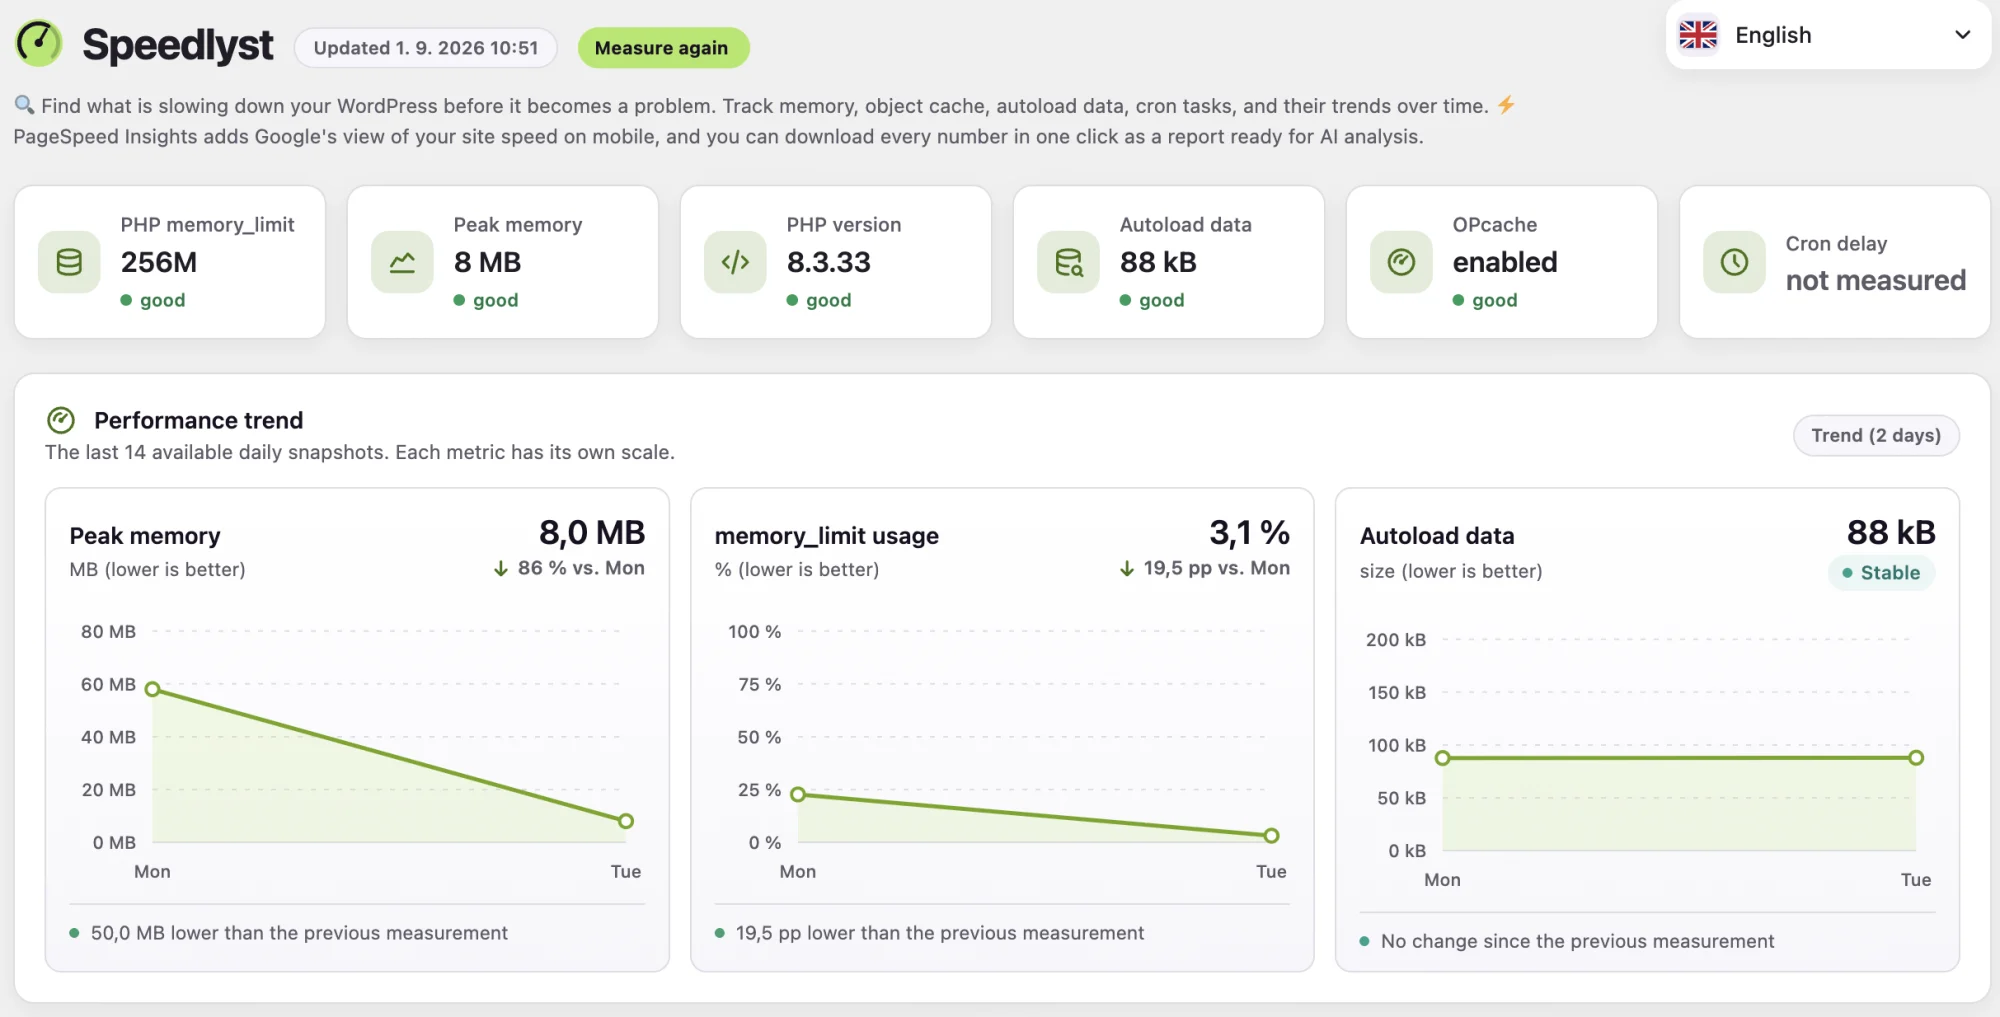
One place for local state, the latest PageSpeed Insights result, and trends in key metrics.
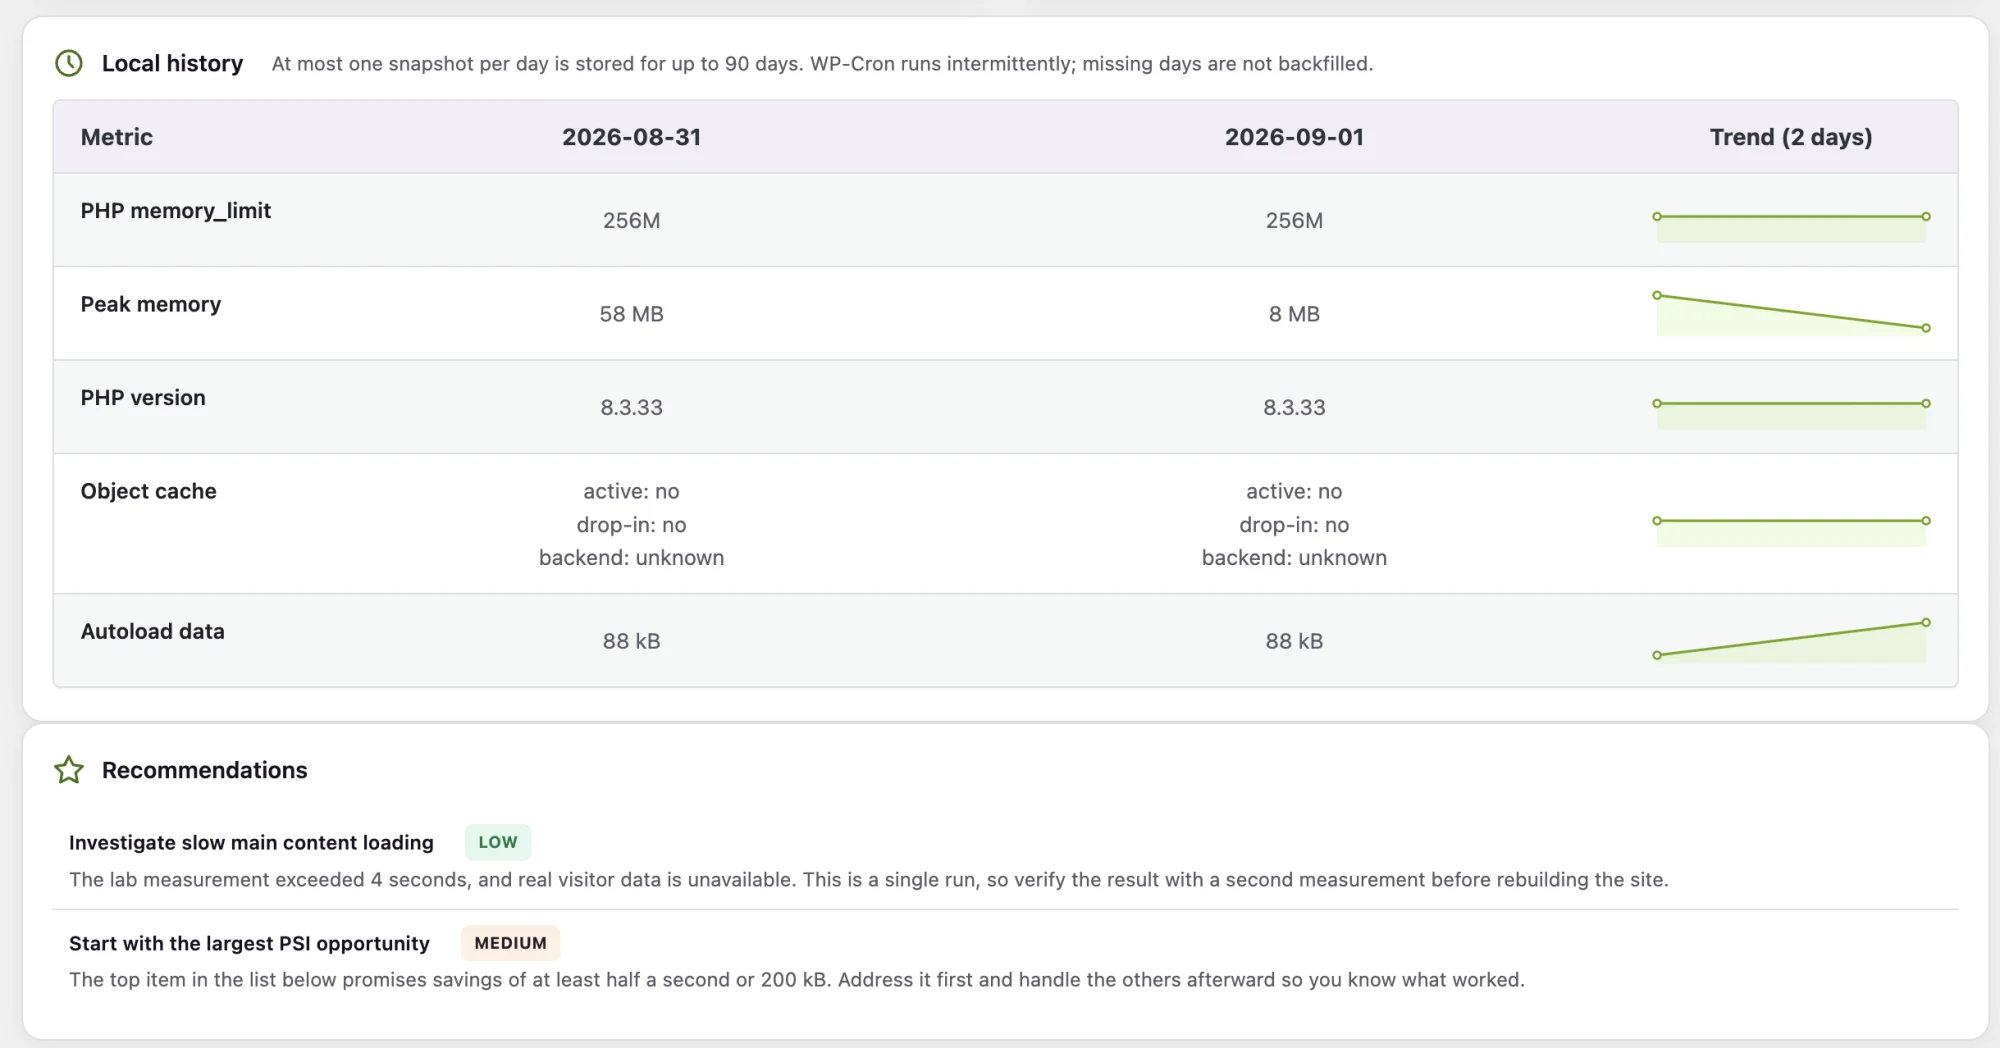
Daily snapshots show whether memory, cache, or the volume of autoload data is gradually getting worse.
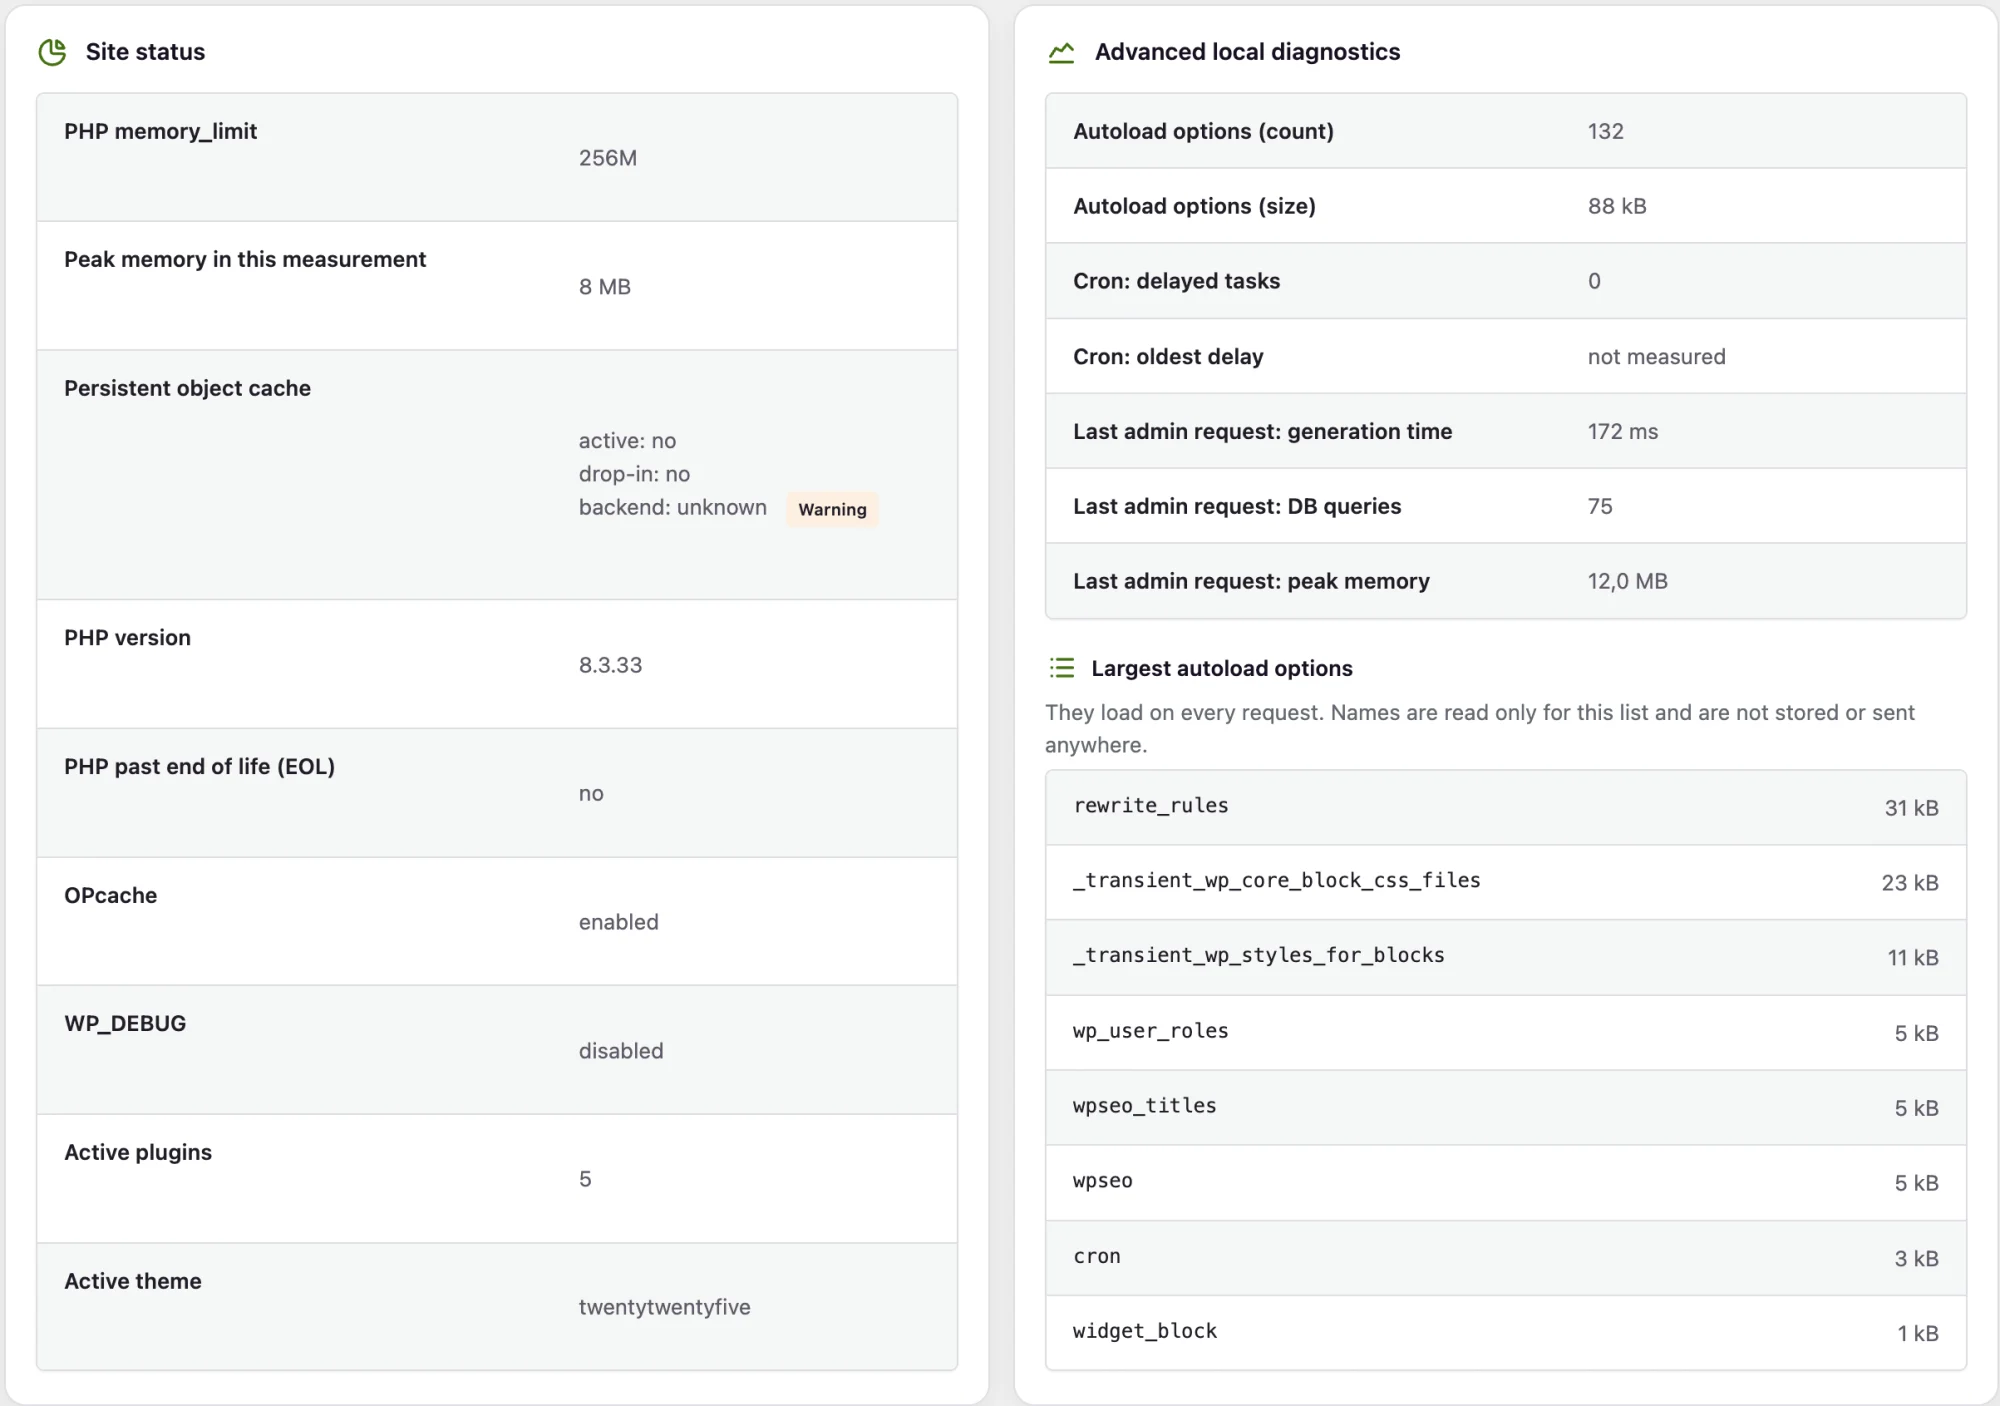
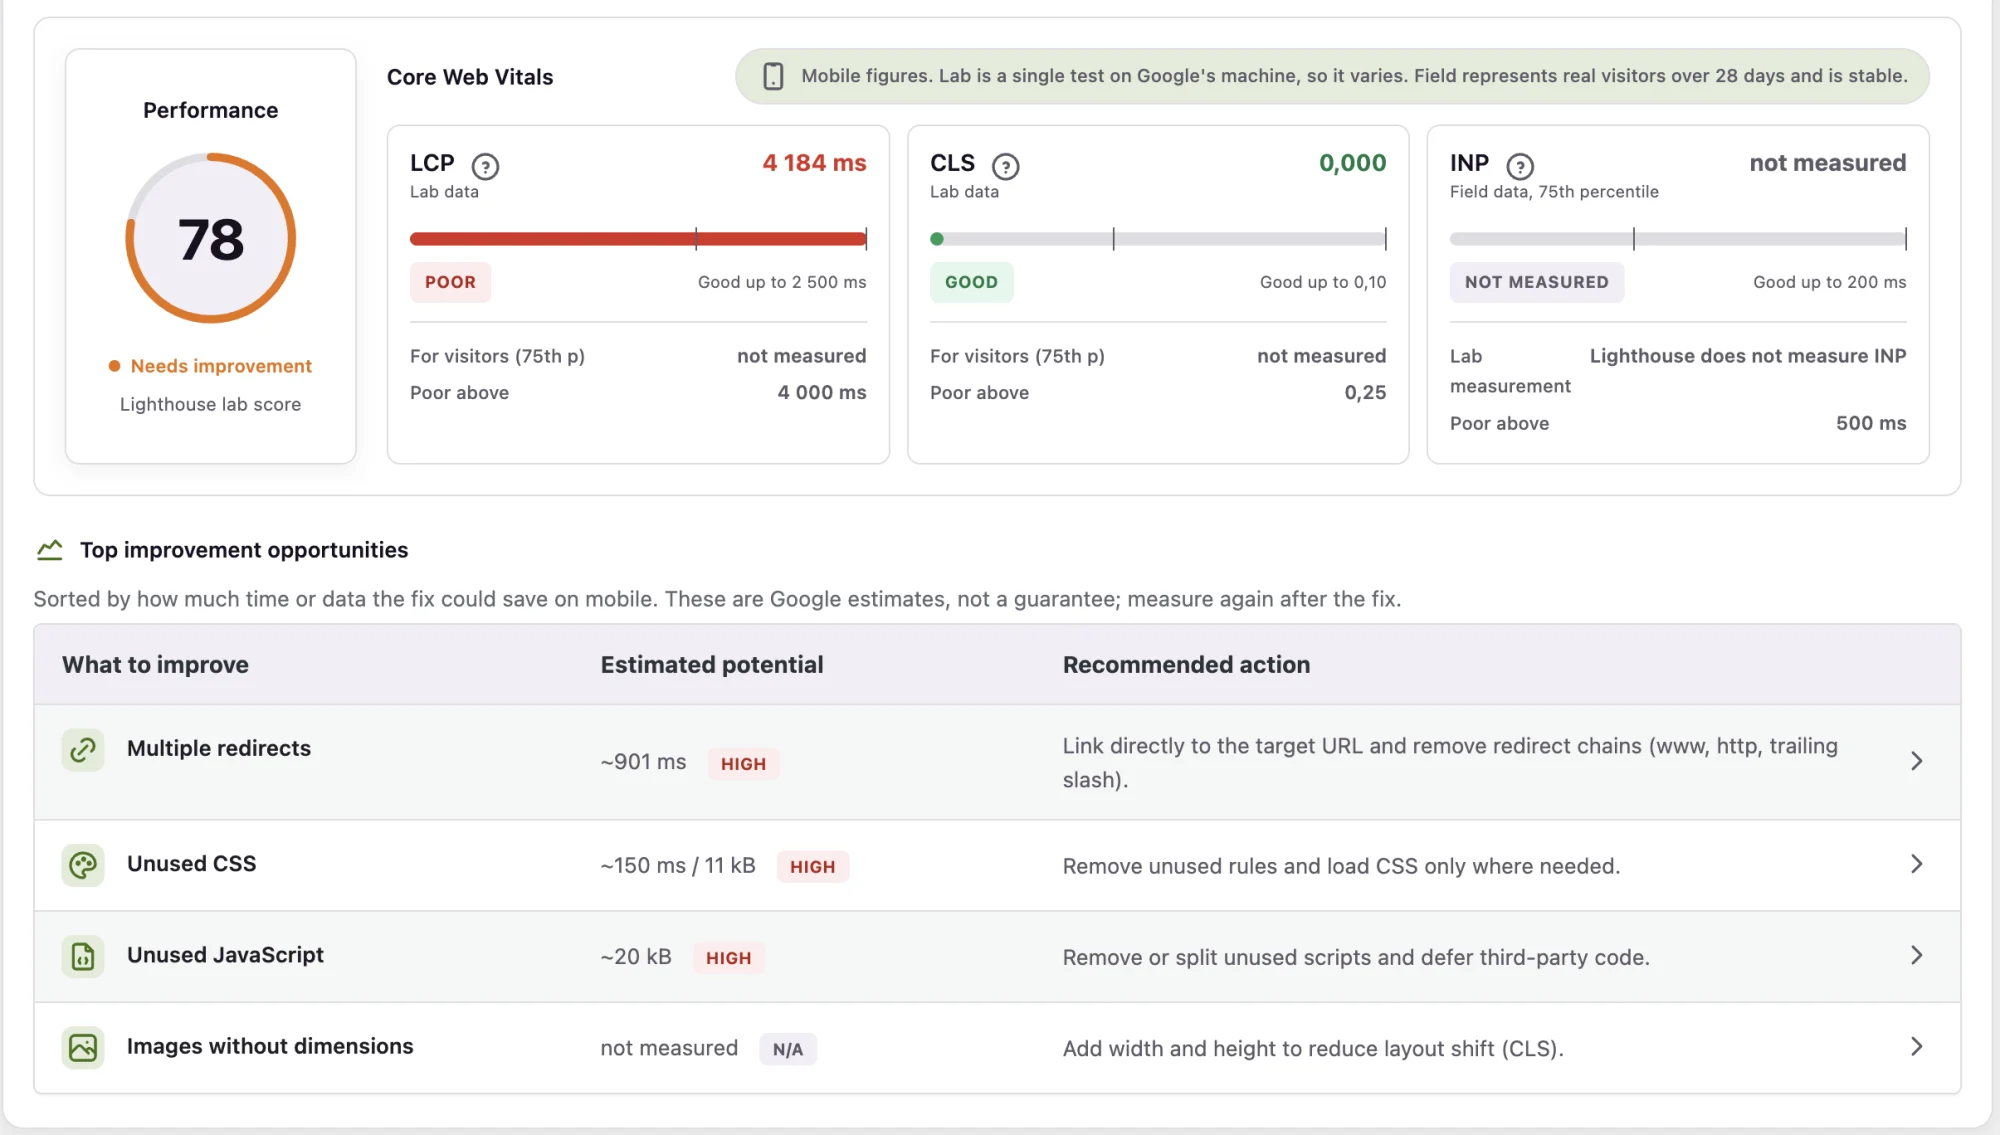
Google PageSpeed Insights describes what your visitor experiences. Local diagnostics add the state of the server and WordPress, which can explain the problem.
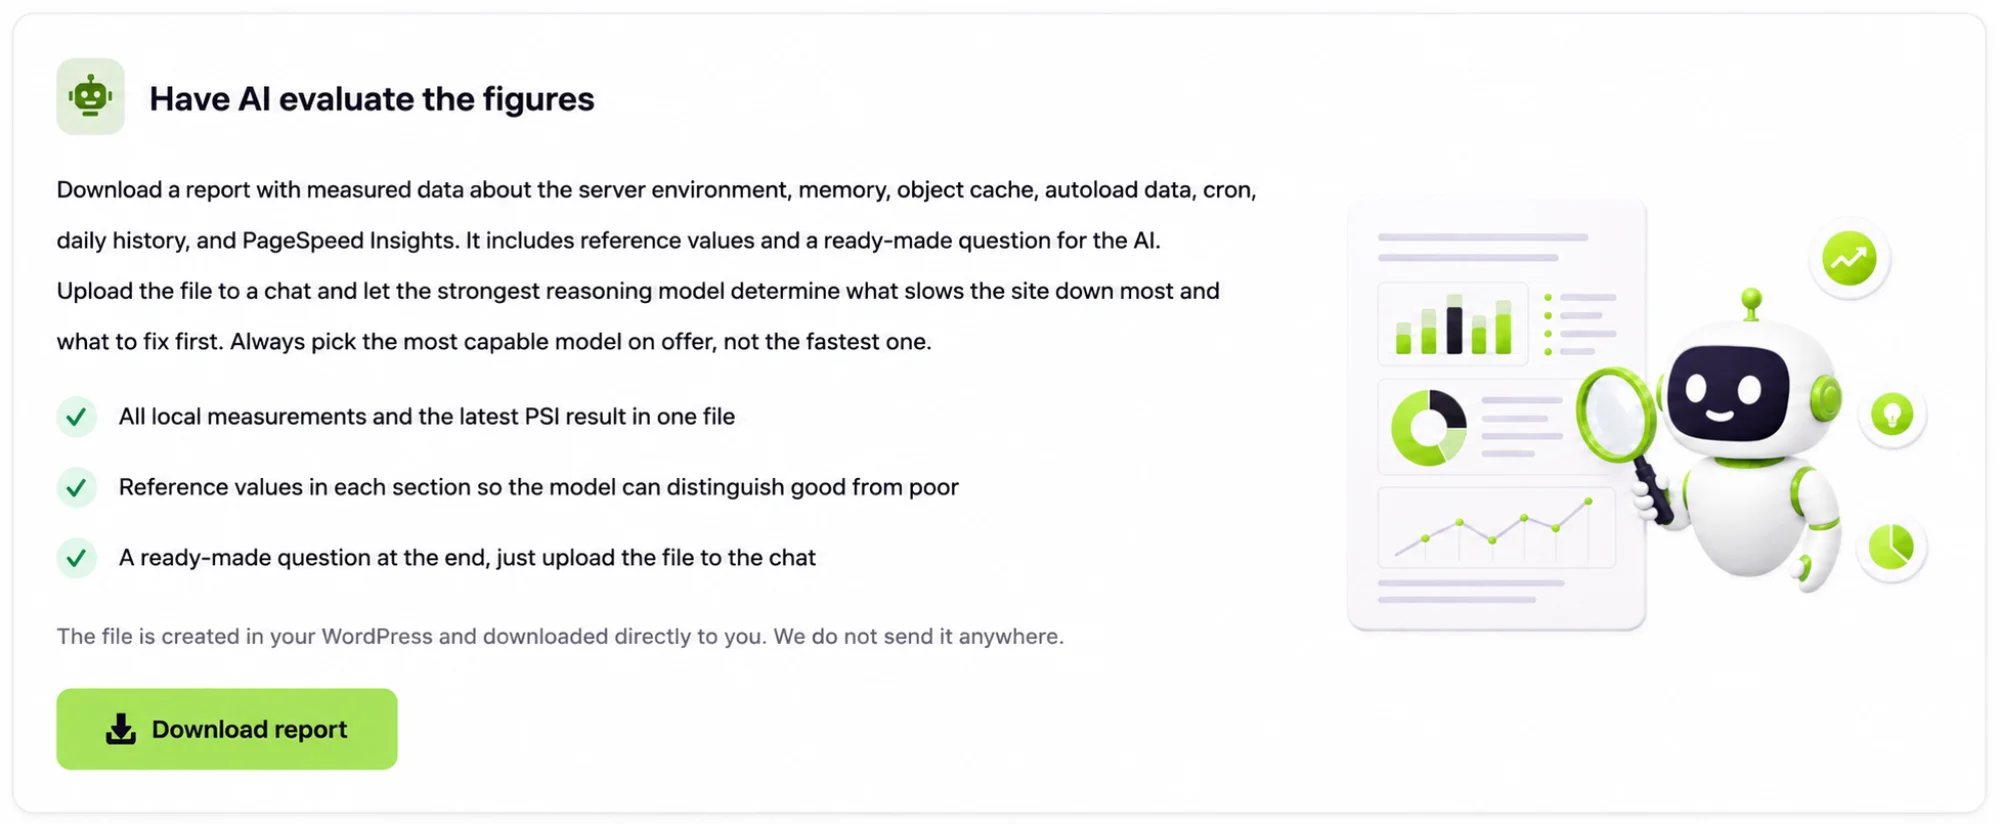
Speedlyst generates a Markdown report with your local metrics, the latest Google PageSpeed Insights measurement, reference values, and a ready-made question.
The same data, three practical ways to use it.
The site owner quickly sees whether the problem is hosting, cache, plugins, or the frontend.
The agency gets one place for the state of a client site, its history, and the evidence behind a recommendation.
The developer gets concrete technical numbers and can verify the real impact after a change.
No. The plugin author's measurement service makes the request, so you do not need to configure an API key, create an account, or register. You can request up to 10 measurements per site per day, and the allowance resets at midnight. The plugin counts your daily allowance per calendar day and resets it at midnight in your site's timezone; the measurement service applies its own rolling 24-hour window, so a burst of requests can still be throttled shortly after midnight.
The Lighthouse laboratory score comes from an individual test on Google's infrastructure. Test conditions can vary between runs, so the score and individual laboratory metrics may vary too. Stored history helps you tell a longer-term trend from a single result.
Field data comes from the Chrome UX Report and is available only when Google has enough real-user data for the measured URL or origin. The plugin still shows laboratory results and marks the missing value as not measured, never as a zero.
No. The measurement service must read a temporary verification value from a public REST route, and Google must load the public page being measured. Password protection, a security plugin, a hosting firewall, or blocked external IP addresses will prevent it. The measurement panel shows the address that must be reachable and the status code your site returned.
Google's thresholds classify LCP of 2.5 seconds or less as good, more than 2.5 up to 4 seconds as needing improvement, and more than 4 seconds as poor. INP of 200 milliseconds or less is good, more than 200 up to 500 needs improvement, and more than 500 is poor. CLS of 0.1 or less is good, more than 0.1 up to 0.25 needs improvement, and more than 0.25 is poor.
Not on its own, but it hands you everything the speed-up is made of. It names the specific step to take first, such as upgrading PHP, enabling OPcache, or reducing autoload data. Putting it into practice is then up to you, your developer, or an AI assistant you pass the ready-made report to, and the daily history shows whether it helped.
Install Speedlyst and get your first local measurement without setting up an API key.
Speedlyst is not affiliated with Google or the WordPress Foundation and is not endorsed by either of them. Google and PageSpeed Insights are trademarks of Google LLC. WordPress is a trademark of the WordPress Foundation.